MP Materials Reports Second Quarter 2021 Results
08/05/2021
Record Quarterly Production, Revenue and Net Income
Accelerates Domestic Magnet Manufacturing Plans; Location TBA Later This Year
Second Quarter 2021 Revenue Grew 141% Year-over-Year to $73.1 million
Second Quarter 2021 Net Income Increased Year-over-Year to $27.2 million
Second Quarter 2021 Adjusted EBITDA Grew 491% Year-over-Year to $46.4 million MOUNTAIN
MOUNTAIN PASS, Calif. – August 5, 2021 – MP Materials Corp. (NYSE: MP) (“MP Materials” or the “Company”), the largest rare earth materials producer in the Western Hemisphere, today announced its financial results for the three months ended June 30, 2021.
“MP Materials’ second quarter results demonstrate our strong execution as demand for rare earth materials continues to grow. The MP team produced the highest quarterly REO output in Mountain Pass history, driving revenues to more than double and Adjusted EBITDA to increase nearly six times compared to the second quarter of 2020,” said MP Materials Chairman and CEO, James H. Litinsky.
“As we continue to drive strong performance in our Stage I operations, we are making steady progress on our Stage II Optimization and remain on-track to deliver our first full year of separated NdPr production in 2023.” Litinsky continued, “In addition, our Stage III team is making significant progress on our strategy to repatriate magnet manufacturing in the United States, and we intend to announce the site of our initial facility this year.”
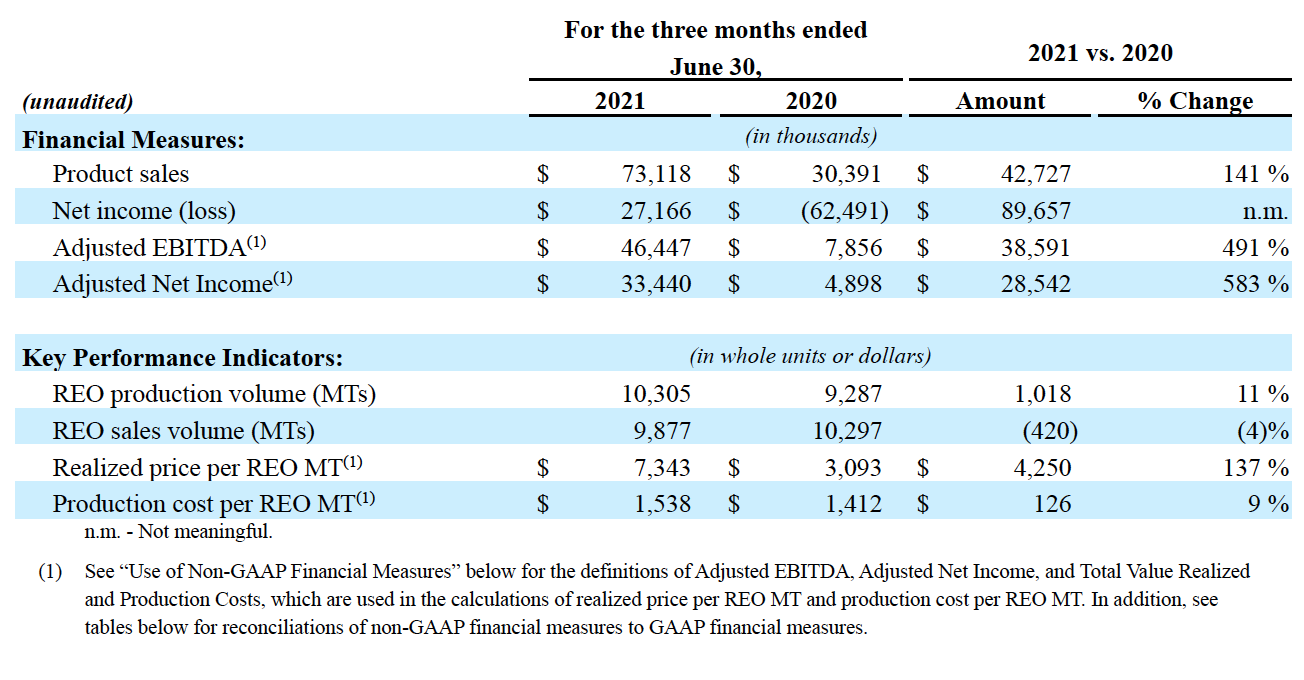
Second Quarter 2021 Financial and Operating Highlights
|
|
For the three months ended
|
|
2021 vs. 2020 |
|||||||||||||||||||||||
|
(unaudited) |
2021 |
|
2020 |
|
Amount Change |
|
% Change |
|||||||||||||||||||
|
Financial Measures: |
|
|
(in thousands) |
|
|
|
|
|||||||||||||||||||
|
Product sales |
$ |
73,118 |
|
|
$ |
30,391 |
|
|
$ |
42,727 |
|
|
141% |
|||||||||||||
|
Net income (loss) |
$ |
27,166 |
|
|
$ |
(62,491) |
|
|
$ |
89,657 |
|
|
n.m. |
|||||||||||||
|
Adjusted EBITDA(1) |
$ |
46,447 |
|
|
$ |
7,856 |
|
|
$ |
38,591 |
|
|
491% |
|||||||||||||
|
Adjusted Net Income(1) |
$ |
33,440 |
|
|
$ |
4,898 |
|
|
$ |
28,542 |
|
|
583% |
|||||||||||||
|
|
|
|
|
|
|
|
|
|||||||||||||||||||
|
Key Performance Indicators: |
(in whole units or dollars) |
|
|
|||||||||||||||||||||||
|
REO production volume (MTs) |
10,305 |
|
|
9,287 |
|
|
1,018 |
|
|
11% |
||||||||||||||||
|
REO sales volume (MTs) |
9,877 |
|
|
10,297 |
|
|
(420) |
|
|
(4)% |
||||||||||||||||
|
Realized price per REO MT(1) |
$ |
7,343 |
|
|
$ |
3,093 |
|
|
$ |
4,250 |
|
|
137% |
|||||||||||||
|
Production cost per REO MT(1) |
$ |
1,538 |
|
|
$ |
1,412 |
|
|
$ |
126 |
|
|
9% |
|||||||||||||
|
n.m. - Not meaningful. |
||||||||||||||||||||||||||
|
(1) |
See “Use of Non-GAAP Financial Measures” below for the definitions of Adjusted EBITDA, Adjusted Net Income, and Total Value Realized and Production Costs, which are used in the calculations of realized price per REO MT and production cost per REO MT. In addition, see tables below for reconciliations of non-GAAP financial measures to GAAP financial measures. |
Revenue increased 141% year-over-year, driven by increases in the realized sales prices of rare earth oxide (“REO”) in concentrate partially offset by slightly lower metric tons (“MT”) of REO sold. The realized sales price increase of 137% was due to higher demand for rare earths driving increased market prices. The 4% decrease in MTs sold was mainly due to the timing of shipments, which fluctuate quarter-to-quarter but approximate production volumes over time. The 11% increase in production volumes compared to the second quarter of 2020 was due to a modest improvement in the efficiency of our processing operations, partially offset by fewer scheduled production hours mainly due to planned maintenance in the quarter.
Adjusted EBITDA increased 491% year-over-year, driven by higher per-unit profitability, partially offset by increased public company and growth and development costs. Per unit profitability improvements were driven primarily by higher realized prices. In addition, production costs would have declined slightly year-over-year in the second quarter when excluding the impact of costs associated with hiring ahead of our Stage II optimization project. On a reported basis, production cost of $1,538 per MT of REO increased 9% year-over-year mainly driven by the impact of employee headcount discussed above, while production efficiencies achieved during the quarter more than offset higher material and supplies costs as well as COVID-19-impacted freight-in costs.
Net income was $27.2 million compared to a net loss of $62.5 million in the prior year period. The improvement was mainly due to a $66.6 million one-time, non-cash charge related to the cancellation of a distribution and marketing agreement in the prior year period, as well as the significantly higher Adjusted EBITDA in the second quarter of 2021. Net income in the second quarter of 2021 was also negatively impacted by higher depletion of the mineral rights resulting from the acquisition of Secure Natural Resources LLC (“SNR”) and a non-cash, stock-based compensation expense related primarily to stock grants issued in connection with MP Materials becoming a public company. Adjusted Net Income increased by 583% year-over-year to $33.4 million, mainly due to the higher Adjusted EBITDA, partially offset by higher income tax expense related mainly to the higher pre-tax earnings.
|
MP MATERIALS CORP. AND SUBSIDIARIES |
|||||||||||||||
|
CONDENSED CONSOLIDATED STATEMENTS OF OPERATIONS |
|||||||||||||||
|
|
|
|
|
|
|
|
|
||||||||
|
|
For the three months
|
|
For the six months ended
|
||||||||||||
|
(in thousands, except share and per share data, unaudited) |
2021 |
|
2020 |
|
2021 |
|
2020 |
||||||||
|
Product sales |
$ |
73,118 |
|
|
$ |
30,391 |
|
|
$ |
133,089 |
|
|
$ |
51,110 |
|
|
|
|
|
|
|
|
|
|
||||||||
|
Operating costs and expenses: |
|
|
|
|
|
|
|
||||||||
|
Cost of sales (including related party)(excluding
|
17,955 |
|
|
16,865 |
|
|
35,891 |
|
|
29,532 |
|
||||
|
Write-down of inventories |
1,809 |
|
|
— |
|
|
1,809 |
|
|
— |
|
||||
|
Royalty expense to SNR |
— |
|
|
366 |
|
|
— |
|
|
853 |
|
||||
|
General and administrative |
13,631 |
|
|
5,843 |
|
|
27,214 |
|
|
8,927 |
|
||||
|
Depreciation, depletion and amortization |
6,666 |
|
|
1,382 |
|
|
12,816 |
|
|
2,653 |
|
||||
|
Accretion of asset retirement and environmental obligations |
592 |
|
|
564 |
|
|
1,185 |
|
|
1,128 |
|
||||
|
Settlement charge |
— |
|
|
66,615 |
|
|
— |
|
|
66,615 |
|
||||
|
Total operating costs and expenses |
40,653 |
|
|
91,635 |
|
|
78,915 |
|
|
109,708 |
|
||||
|
Operating income (loss) |
32,465 |
|
|
(61,244) |
|
|
54,174 |
|
|
(58,598) |
|
||||
|
Other income, net |
3,504 |
|
|
155 |
|
|
3,559 |
|
|
237 |
|
||||
|
Interest expense, net |
(2,639) |
|
|
(1,066) |
|
|
(3,793) |
|
|
(1,869) |
|
||||
|
Income (loss) before income taxes |
33,330 |
|
|
(62,155) |
|
|
53,940 |
|
|
(60,230) |
|
||||
|
Income tax expense |
(6,164) |
|
|
(336) |
|
|
(10,655) |
|
|
(336) |
|
||||
|
Net income (loss) |
$ |
27,166 |
|
|
$ |
(62,491) |
|
|
$ |
43,285 |
|
|
$ |
(60,566) |
|
|
|
|
|
|
|
|
|
|
||||||||
|
Net income (loss) per share: |
|
|
|
|
|
|
|
||||||||
|
Basic |
$ |
0.16 |
|
|
$ |
(0.92) |
|
|
$ |
0.25 |
|
|
$ |
(0.90) |
|
|
Diluted |
$ |
0.15 |
|
|
$ |
(0.92) |
|
|
$ |
0.24 |
|
|
$ |
(0.90) |
|
|
|
|
|
|
|
|
|
|
||||||||
|
Weighted-average shares outstanding: |
|
|
|
|
|
|
|
||||||||
|
Basic |
172,677,923 |
|
68,095,422 |
|
170,810,353 |
|
67,326,198 |
||||||||
|
Diluted |
193,145,644 |
|
68,095,422 |
|
186,282,857 |
|
67,326,198 |
||||||||
|
MP MATERIALS CORP. AND SUBSIDIARIES |
|||||||||||||||
|
Reconciliation of GAAP Net Income (Loss) to Non-GAAP Adjusted EBITDA |
|||||||||||||||
|
|
|
|
|
|
|
|
|
||||||||
|
|
For the three months ended
|
|
For the six months ended
|
||||||||||||
|
(in thousands, unaudited) |
2021 |
|
2020 |
|
2021 |
|
2020 |
||||||||
|
Net income (loss) |
$ |
27,166 |
|
|
$ |
(62,491) |
|
|
$ |
43,285 |
|
|
$ |
(60,566) |
|
|
Adjusted for: |
|
|
|
|
|
|
|
||||||||
|
Depreciation, depletion and amortization |
6,666 |
|
|
1,382 |
|
|
12,816 |
|
|
2,653 |
|
||||
|
Interest expense, net |
2,639 |
|
|
1,066 |
|
|
3,793 |
|
|
1,869 |
|
||||
|
Income tax expense |
6,164 |
|
|
336 |
|
|
10,655 |
|
|
336 |
|
||||
|
Stock-based compensation expense(1) |
4,498 |
|
|
— |
|
|
10,171 |
|
|
— |
|
||||
|
Transaction-related and other non-recurring costs(2) |
247 |
|
|
1,619 |
|
|
1,305 |
|
|
1,831 |
|
||||
|
Accretion of asset retirement and environmental obligations |
592 |
|
|
564 |
|
|
1,185 |
|
|
1,128 |
|
||||
|
Loss on sale or disposal of long lived-assets, net(3) |
170 |
|
|
— |
|
|
37 |
|
|
— |
|
||||
|
Write-down of inventories(4) |
1,809 |
|
|
— |
|
|
1,809 |
|
|
— |
|
||||
|
Royalty expense to SNR |
— |
|
|
366 |
|
|
— |
|
|
853 |
|
||||
|
Settlement charge(5) |
— |
|
|
66,615 |
|
|
— |
|
|
66,615 |
|
||||
|
Tariff rebate(6) |
— |
|
|
(1,446) |
|
|
(2,050) |
|
|
(1,446) |
|
||||
|
Other income, net(7) |
(3,504) |
|
|
(155) |
|
|
(3,559) |
|
|
(237) |
|
||||
|
Adjusted EBITDA |
$ |
46,447 |
|
|
$ |
7,856 |
|
|
$ |
79,447 |
|
|
$ |
13,036 |
|
|
(1) |
|
Principally included in “General and administrative” within our unaudited Condensed Consolidated Statements of Operations. Approximately $3.7 million and $7.8 million of the amounts for the three and six months ended June 30, 2021, respectively, pertained to a one-time grant of stock awards to employees and executives upon the consummation of the business combination on November 17, 2020, whereby MP Mine Operations LLC and SNR were combined with Fortress Value Acquisition Corp., a special purpose acquisition company (“FVAC”) (the “Business Combination”), and became indirect wholly-owned subsidiaries of FVAC, which was in turn renamed MP Materials Corp. |
|
|
(2) |
|
Amounts for the three and six months ended June 30, 2021, relate to advisory, consulting, accounting and legal expenses principally in connection with the secondary equity offering, which was completed contemporaneously with an offering by the Company of green convertible senior notes (the “Convertible Notes”) in March 2021, and the redemption of the Company’s public warrants in May and June 2021. The Company did not receive any proceeds from the secondary equity offering. Amounts for the three and six months ended June 30, 2020, include mainly advisory, consulting, accounting and legal expenses in connection with the Business Combination. |
|
|
(3) |
|
Included in “General and administrative” within our unaudited Condensed Consolidated Statements of Operations. |
|
|
(4) |
|
Represents a non-cash write-down of a portion of our legacy low-grade stockpile inventory during the second quarter of 2021 after determining that the inventory contained a significant amount of alluvial material that did not meet the Company’s requirement for mill feed. |
|
|
(5) |
|
In connection with terminating the Distribution and Marketing Agreement (“DMA”) with Shenghe in June 2020, we recognized a one-time, non-cash settlement charge. |
|
|
(6) |
|
Represents non-cash revenue recognized in connection with tariff rebates received relating to product sales from prior periods. |
|
|
(7) |
|
Principally represents a non-cash gain recognized as a result of the Small Business Administration’s approval to forgive the Paycheck Protection Loan, which had a principal amount of $3.4 million. |
|
MP MATERIALS CORP. AND SUBSIDIARIES |
|||||||||||||||
|
Reconciliation of GAAP Net Income (Loss) to Non-GAAP Adjusted Net Income |
|||||||||||||||
|
|
|
|
|
|
|
|
|
||||||||
|
|
For the three months ended
|
|
For the six months ended
|
||||||||||||
|
(in thousands, unaudited) |
2021 |
|
2020 |
|
2021 |
|
2020 |
||||||||
|
Net income (loss) |
$ |
27,166 |
|
|
$ |
(62,491) |
|
|
$ |
43,285 |
|
|
$ |
(60,566) |
|
|
Adjusted for: |
|
|
|
|
|
|
|
||||||||
|
Depletion(1) |
4,686 |
|
|
28 |
|
|
9,217 |
|
|
57 |
|
||||
|
Stock-based compensation expense(2) |
4,498 |
|
|
— |
|
|
10,171 |
|
|
— |
|
||||
|
Transaction-related and other non-recurring costs(3) |
247 |
|
|
1,619 |
|
|
1,305 |
|
|
1,831 |
|
||||
|
Loss on sale or disposal of long-lived assets, net(4) |
170 |
|
|
— |
|
|
37 |
|
|
— |
|
||||
|
Write-down of inventories(5) |
1,809 |
|
|
— |
|
|
1,809 |
|
|
— |
|
||||
|
Royalty expense to SNR |
— |
|
|
366 |
|
|
— |
|
|
853 |
|
||||
|
Settlement charge(6) |
— |
|
|
66,615 |
|
|
— |
|
|
66,615 |
|
||||
|
Tariff rebate(7) |
— |
|
|
(1,446) |
|
|
(2,050) |
|
|
(1,446) |
|
||||
|
Other income, net(8) |
(3,504) |
|
|
(155) |
|
|
(3,559) |
|
|
(237) |
|
||||
|
Tax impact of adjustments above(9) |
(1,632) |
|
|
362 |
|
|
(3,569) |
|
|
378 |
|
||||
|
Adjusted Net Income |
$ |
33,440 |
|
|
$ |
4,898 |
|
|
$ |
56,646 |
|
|
$ |
7,485 |
|
|
(1) |
|
Principally includes the depletion associated with the mineral rights for the rare earth ores contained in the Company’s mine, which were recorded in connection with the acquisition of SNR at fair value as of the date of the Business Combination, resulting in a significant step-up of the carrying amount of the asset. |
|
|
(2) |
|
Principally included in “General and administrative” within our unaudited Condensed Consolidated Statements of Operations. Approximately $3.7 million and $7.8 million of the amounts for the three and six months ended June 30, 2021, respectively, pertained to a one-time grant of stock awards to employees and executives upon the consummation of the Business Combination. |
|
|
(3) |
|
Amounts for the three and six months ended June 30, 2021, relate to advisory, consulting, accounting and legal expenses principally in connection with the secondary equity offering, which was completed contemporaneously with the Convertible Notes offering in March 2021, and the redemption of the Company’s public warrants in May and June 2021. The Company did not receive any proceeds from the secondary equity offering. Amounts for the three and six months ended June 30, 2020, include mainly advisory, consulting, accounting and legal expenses in connection with the Business Combination. |
|
|
(4) |
|
Included in “General and administrative” within our unaudited Condensed Consolidated Statements of Operations. |
|
|
(5) |
|
Represents a non-cash write-down of a portion of our legacy low-grade stockpile inventory during the second quarter of 2021 after determining that the inventory contained a significant amount of alluvial material that did not meet the Company’s requirement for mill feed. |
|
|
(6) |
|
In connection with terminating the DMA with Shenghe in June 2020, we recognized a one-time, non-cash settlement charge. |
|
|
(7) |
|
Represents non-cash revenue recognized in connection with tariff rebates received relating to product sales from prior periods. |
|
|
(8) |
|
Principally represents a non-cash gain recognized as a result of the Small Business Administration’s approval to forgive the Paycheck Protection Loan, which had a principal amount of $3.4 million. |
|
|
(9) |
|
Tax impact of adjustments is calculated using an adjusted effective tax rate, excluding the impact of discrete tax costs and benefits, to each adjustment. The adjusted effective tax rates were 20.6%, 21.1%, (0.5)%, and (0.6)% for the three and six months ended June 30, 2021 and 2020, respectively. The rates for the three and six months ended June 30, 2020, reflect a full valuation allowance. |
|
MP MATERIALS CORP. AND SUBSIDIARIES |
|||||||||||||||
|
Reconciliation of GAAP Product Sales to Non-GAAP Total Value Realized |
|||||||||||||||
|
|
|
|
|
|
|
|
|
||||||||
|
|
For the three months ended
|
|
For the six months ended
|
||||||||||||
|
(in thousands, unless otherwise stated, unaudited) |
2021 |
|
2020 |
|
2021 |
|
2020 |
||||||||
|
Product sales |
$ |
73,118 |
|
|
$ |
30,391 |
|
|
$ |
133,089 |
|
|
$ |
51,110 |
|
|
Adjusted for: |
|
|
|
|
|
|
|
||||||||
|
Shenghe Implied Discount(1) |
— |
|
|
3,023 |
|
|
— |
|
|
3,630 |
|
||||
|
Other(2) |
(596) |
|
|
(1,563) |
|
|
(2,878) |
|
|
(1,721) |
|
||||
|
Total Value Realized(3) |
$ |
72,522 |
|
|
$ |
31,851 |
|
|
$ |
130,211 |
|
|
$ |
53,019 |
|
|
|
|
|
|
|
|
|
|
||||||||
|
Total Value Realized(3) |
$ |
72,522 |
|
|
$ |
31,851 |
|
|
$ |
130,211 |
|
|
$ |
53,019 |
|
|
Divided by: |
|
|
|
|
|
|
|
||||||||
|
REO sales volume (in MTs) |
9,877 |
|
|
10,297 |
|
|
19,670 |
|
|
18,618 |
|
||||
|
Realized price per REO MT (in dollars)(4) |
$ |
7,343 |
|
|
$ |
3,093 |
|
|
$ |
6,620 |
|
|
$ |
2,848 |
|
|
(1) |
|
Represents the difference between the contractual amount realized by Shenghe Resources (Singapore) International Trading Pte. Ltd. (“Shenghe”) and the amount of deferred revenue we recognized. |
|
|
(2) |
|
The amounts for the six months ended June 30, 2021, and the three and six months ended June 30, 2020, pertain primarily to tariff rebates due to the retroactive effect of lifting the Chinese tariffs in May 2020. The amount for the three months ended June 30, 2021, pertains to revenue recognized under our government contracts. |
|
|
(3) |
|
See “Use of Non-GAAP Financial Measures” below for definition and further information. |
|
|
(4) |
|
May not recompute as presented due to rounding. |
|
MP MATERIALS CORP. AND SUBSIDIARIES |
|||||||||||||||
|
Reconciliation of GAAP Cost of Sales to Non-GAAP Production Costs |
|||||||||||||||
|
|
|
|
|
|
|
|
|
||||||||
|
|
For the three months ended
|
|
For the six months ended
|
||||||||||||
|
(in thousands, unless otherwise stated, unaudited) |
2021 |
|
2020 |
|
2021 |
|
2020 |
||||||||
|
Cost of sales(1) |
$ |
17,955 |
|
|
$ |
16,865 |
|
|
$ |
35,891 |
|
|
$ |
29,532 |
|
|
Adjusted for: |
|
|
|
|
|
|
|
||||||||
|
Cost attributable to sales of stockpiles |
(6) |
|
|
(112) |
|
|
(79) |
|
|
(262) |
|
||||
|
Stock-based compensation expense(2) |
(578) |
|
|
— |
|
|
(1,896) |
|
|
— |
|
||||
|
Shipping and freight |
(2,183) |
|
|
(2,210) |
|
|
(4,281) |
|
|
(3,912) |
|
||||
|
Production Costs(3) |
$ |
15,188 |
|
|
$ |
14,543 |
|
|
$ |
29,635 |
|
|
$ |
25,358 |
|
|
|
|
|
|
|
|
|
|
||||||||
|
Production Costs(3) |
$ |
15,188 |
|
|
$ |
14,543 |
|
|
$ |
29,635 |
|
|
$ |
25,358 |
|
|
Divided by: |
|
|
|
|
|
|
|
||||||||
|
REO sales volume (in MTs) |
9,877 |
|
|
10,297 |
|
|
19,670 |
|
|
18,618 |
|
||||
|
Production cost per REO MT (in dollars)(4) |
$ |
1,538 |
|
|
$ |
1,412 |
|
|
$ |
1,507 |
|
|
$ |
1,362 |
|
|
(1) |
|
Excluding depreciation, depletion and amortization. |
|
|
(2) |
|
Pertains only to the amount of stock-based compensation expense included in cost of sales (as opposed to general and administrative). |
|
|
(3) |
|
See “Use of Non-GAAP Financial Measures” below for definition and further information. |
|
|
(4) |
|
May not recompute as presented due to rounding. |
Conference Call Details
MP Materials will host a conference call to discuss these results at 2 p.m. Pacific Time, Thursday, August 5, 2021. To access the conference call, participants should dial (844) 200-6205 and international participants should dial 44 208 0682 558 and enter the conference ID number 336802. The live audio webcast along with the press release and accompanying slide presentation, will be accessible at investors.mpmaterials.com. A recording of the webcast will also be available following the conference call.
About MP Materials
MP Materials Corp. (NYSE: MP) is the largest producer of rare earth materials in the Western Hemisphere. With over 300 employees, the Company owns and operates the Mountain Pass Rare Earth Mine and Processing Facility (“Mountain Pass”), an iconic American industrial asset, which is the only rare earth mining and processing site of scale in the Western Hemisphere and produced approximately 15% of the rare earth content consumed in the global market in 2020. Separated rare earth elements are critical inputs for the magnets that enable the mobility of electric vehicles, drones, defense systems, wind turbines, robotics and many other high-growth, advanced technologies. MP Materials’ integrated operations at Mountain Pass combine low production costs with high environmental standards, thereby restoring American leadership to a critical industry with a strong commitment to sustainability. More information is available at https://mpmaterials.com/.
We routinely post important information on our website, including corporate and investor presentations and financial information. We intend to use our website as a means of disclosing material, non-public information and for complying with our disclosure obligations under Regulation FD. Such disclosures will be included in the Investors section of our website. Accordingly, investors should monitor such portion of our website, in addition to following our press releases, Securities and Exchange filings and public conference calls and webcasts.
Forward Looking Statements
Certain statements included in this press release that are not historical facts are forward-looking statements for purposes of the safe harbor provisions under the United States Private Securities Litigation Reform Act of 1995. Forward-looking statements may be identified by the use of the words such as “estimate,” “plan,” “project,” “forecast,” “intend,” “expect,” “anticipate,” “believe,” “seek,” “will,” “target,” or similar expressions that predict or indicate future events or trends or that are not statements of historical matters. These forward-looking statements include, but are not limited to, statements regarding estimates and forecasts of other financial and performance metrics and projections of market opportunity. These statements are based on various assumptions, whether or not identified in this press release, and on the current expectations of MP Materials’ management and are not predictions of actual performance. These forwardlooking statements are provided for illustrative purposes only and are not intended to serve as, and must not be relied on by any investor as, a guarantee, an assurance, a prediction or a definitive statement of fact or probability. Actual events and circumstances are difficult or impossible to predict and will differ from assumptions. Many actual events and circumstances are beyond the control of MP Materials. These forward-looking statements are subject to a number of risks and uncertainties, including unanticipated costs or delays associated with our Stage II optimization project; uncertainties relating to our commercial arrangements with Shenghe; our ability to convert current commercial discussions with customers for the sale of rare earth oxide products into contracts; potential changes in China’s political environment and policies; fluctuations in demand for, and prices of, rare earth minerals and products; uncertainties relating to the COVID- 19 pandemic; the intense competition within the rare earths mining and processing industry; uncertainties regarding the growth of existing and emerging uses for rare earth products; potential power shortages at the Mountain Pass facility; increasing costs or limited access to raw materials that may adversely affect our profitability; fluctuations in transportation costs or disruptions in transportation services; inability to meet individual customer specifications; 9 diminished access to water; uncertainty in our estimates of rare earth oxide reserves; uncertainties regarding our ability to vertically integrate into further downstream processing and reach full revenue potential; risks associated with work stoppages; a shortage of skilled technicians and engineers; loss of key personnel; risks associated with the inherent dangers involved in mining activity; risks associated with events outside of our control, such as natural disasters, wars or health epidemics or pandemics; risks related to technology systems and security breaches; risks associated with our intellectual property rights; ability to compete with substitutions for rare earth minerals; ability to maintain satisfactory labor relations; risks relating to extensive and costly environmental regulatory requirements; risks associated with the terms of our convertible notes; and the other factors described in our Annual Report on Form 10-K for the year ended December 31, 2020 under the headings “Risk Factors,” “Cautionary Note Regarding Forward-Looking Statements,” and “Management’s Discussion and Analysis of Financial Conditions and Results of Operations,” or as described in the other documents and reports we file with the Securities and Exchange Commission (“SEC”). If any of these risks materialize or our assumptions prove incorrect, actual results could differ materially from the results implied by these forwardlooking statements. There may be additional risks that MP Materials does not presently know or that MP Materials currently believes are immaterial that could also cause actual results to differ from those contained in the forwardlooking statements. In addition, forward-looking statements reflect MP Materials’ expectations, plans or forecasts of future events and views as of the date of this press release. MP Materials anticipates that subsequent events and developments will cause MP Materials’ assessments to change. However, while MP Materials may elect to update these forward looking statements at some point in the future, MP Materials specifically disclaims any obligation to do so, unless required by applicable law. These forward-looking statements should not be relied upon as representing MP Materials’ assessments as of any date subsequent to the date of this press release. Accordingly, undue reliance should not be placed upon the forward-looking statements.
Use of Non-GAAP Financial Measures
This press release references certain non-GAAP financial measures, including Adjusted EBITDA, Adjusted Net Income, Total Value Realized, and Production Costs. We define Adjusted EBITDA as our GAAP net income or loss before interest expense, net; income tax expense or benefit; and depreciation, depletion and amortization; further adjusted to eliminate the impact of stock-based compensation expense; transaction-related and other non-recurring costs; non-cash accretion of asset retirement and environmental obligations; gain or loss on sale or disposal of long-lived assets; royalty expense to SNR; tariff rebates; and other income or loss, net. Adjusted Net Income is defined as our GAAP net income or loss excluding the impact of depletion; stock-based compensation expense; transaction-related and other non-recurring costs; gain on sale or disposal of long-lived assets; royalty expense to SNR; tariff rebates; and other income or loss, net; adjusted to give effect to the income tax impact of such adjustments. Total Value Realized, which we use to calculate our key performance indicator, realized price per REO MT, is defined as GAAP product sales adjusted for (x) the revenue impact of tariff-related rebates from Shenghe on account of prior sales, (y) in connection with our sales of REO to Shenghe between July 1, 2019, and June 5, 2020, the Shenghe Implied Discount, and (z) sales of legacy stockpiles. The Shenghe Implied Discount is equal to the difference between (i) Shenghe’s average realized price, net of taxes, tariffs and certain other agreed-upon charges (such as one-time demurrage charges) on our products once sold to their ultimate customers and (ii) the amount of revenue we recognized on the sales of those products to Shenghe for sales between July 1, 2019, and June 5, 2020, which includes a non-cash portion. See Note 4, “Relationship and Agreements with Shenghe,” and Note 5, “Revenue Recognition,” in our Annual Report on Form 10-K for the year ended December 31, 2020, for more information on the Shenghe Implied Discount. Realized price per REO MT is calculated as the quotient of: (i) our Total Value Realized for a given period and (ii) our REO sales volume for the same period. Production Costs, which we use to calculate our key performance indicator, production cost per REO MT, is defined as our cost of sales (excluding depreciation, depletion and amortization), less costs attributable to sales of legacy stockpiles, stock-based compensation expense included in cost of sales (as opposed to general and administrative), and shipping and freight costs. Production cost per REO MT is calculated as the quotient of: (i) our Production Costs for a given period and (ii) our REO sales volume for the same period.
MP Materials’ management uses Adjusted EBITDA, Adjusted Net Income, and other non-GAAP financial measures to compare MP Materials’ performance to that of prior periods for trend analyses and for budgeting and planning purposes. MP Materials believes Adjusted EBITDA and Adjusted Net Income provide useful information to management and investors regarding certain financial and business trends relating to MP Materials’ financial condition and results of operations. MP Materials believes that the use of Adjusted EBITDA and Adjusted Net Income provide an additional tool for investors to use in evaluating projected operating results and trends. MP Materials believes realized price per REO MT, which utilizes the non-GAAP financial measure, Total Value Realized, is an important measure of the market price of the Company’s product. Furthermore, MP Materials believes production cost per REO MT sold, which utilizes the non-GAAP financial measure, Production Costs, is a key indicator of the Company’s production efficiency. MP Materials’ method of determining these non-GAAP measures may be different from other companies’ methods and, therefore, may not be comparable to those used by other companies and MP Materials does not recommend the sole use of these non-GAAP measures to assess its financial performance. Management does not consider non-GAAP measures in isolation or as an alternative or to be superior to financial measures determined in accordance with GAAP. The principal limitation of non-GAAP financial measures is that they exclude significant expenses and income that are required by GAAP to be recorded in MP Materials’ financial statements. In addition, they are subject to inherent limitations as they reflect the exercise of judgments by management about which expense and income are excluded or included in determining these non-GAAP financial measures. In order to compensate for these limitations, management presents reconciliations of such non-GAAP financial measures to the most directly comparable GAAP financial measures.
Contacts
Investors:
IR@mpmaterials.com
Media:
Matt Sloustcher
media@mpmaterials.com
212-257-4170